Windows kernel debugging
Table of Contents
0x00. Introduction
This post covers setting up an environment for Windows kernel analysis and documents useful commands.
0x01. Setup
Host (Debugger)
Previously, the setup process was complex with Windows SDK, Virtual KD, etc. for convenience. Now it’s much simpler with the official WinDbg release. Just install WinDbg from the Microsoft Store and run it.
From the top menu, go to File -> Start Debugging -> Attach to kernel, select COM, and configure as follows:
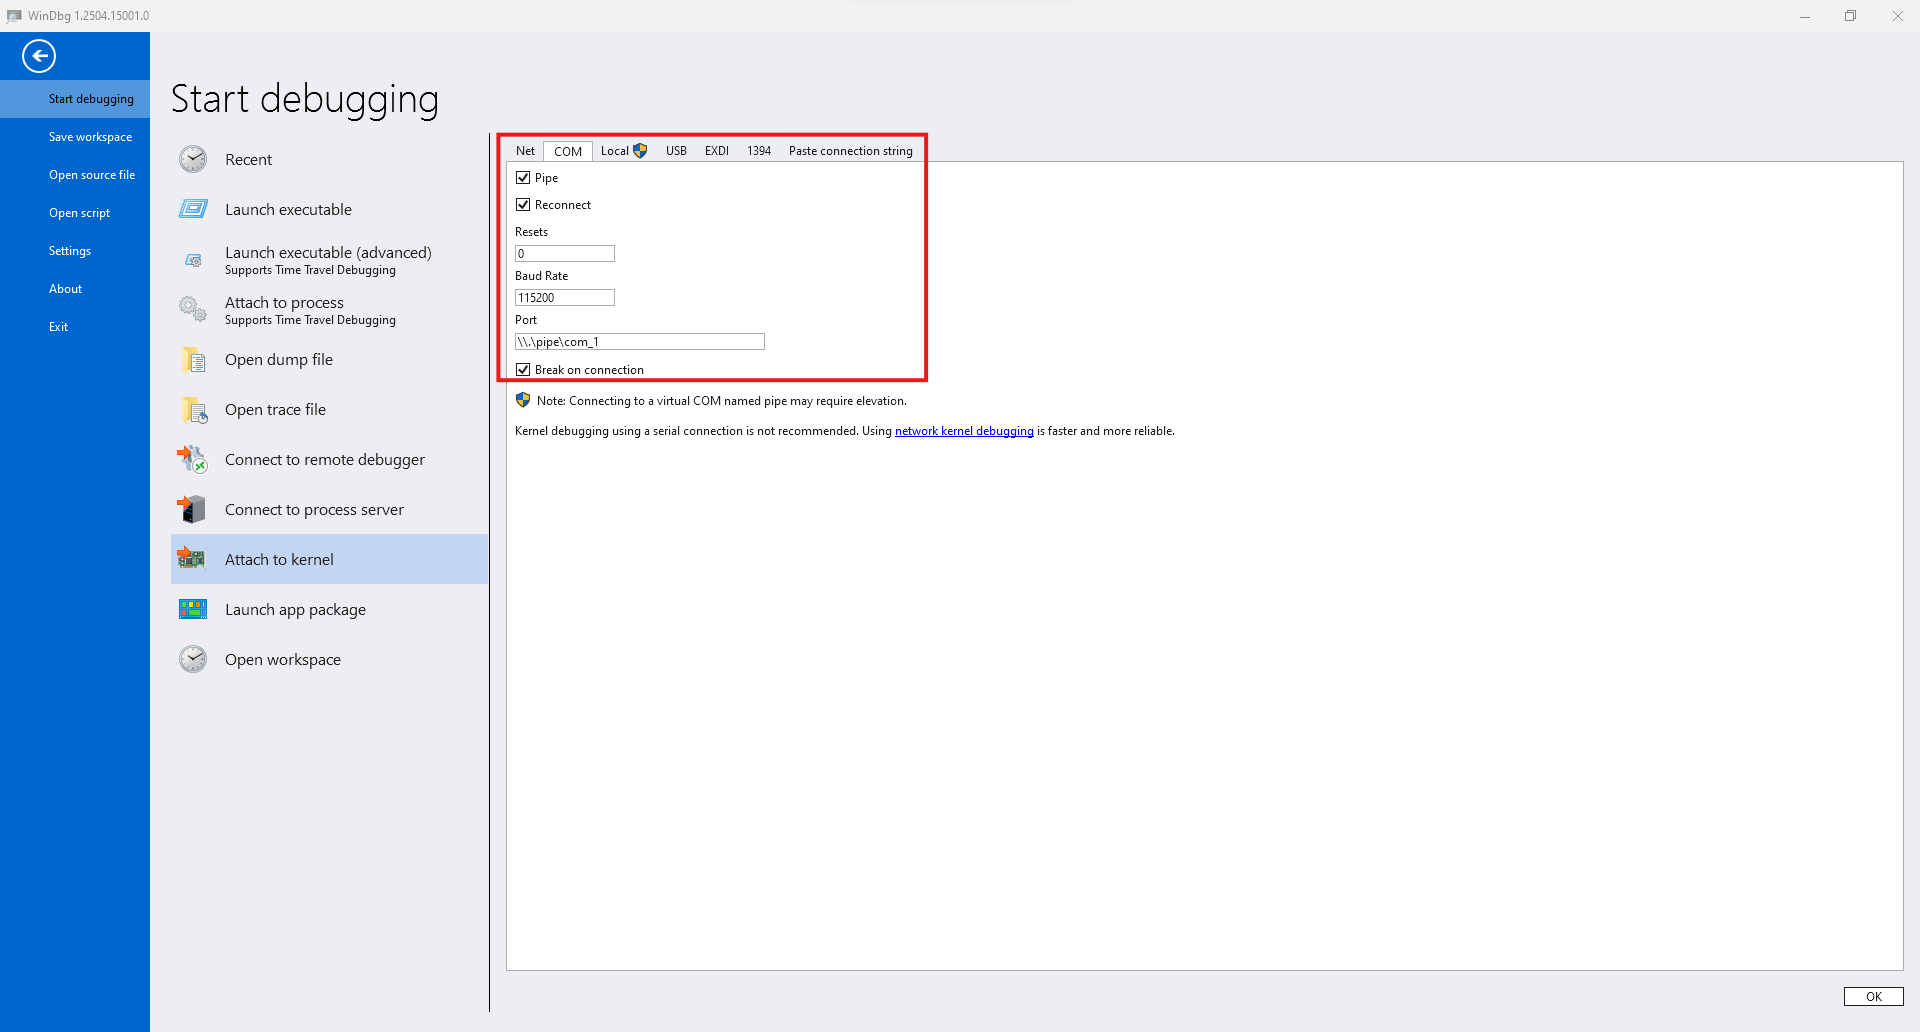
After completing the configuration and clicking “OK” in the lower right, it enters debugging standby mode.
Guest (Debuggee)
The debugging target can be set up through various programs. This post describes the configuration method when using VMware.
First, start the target VM, run PowerShell with administrator privileges, and execute these commands:
bcdedit /debug on
bcdedit /dbgsettings serial debugport:1 baudrate:115200
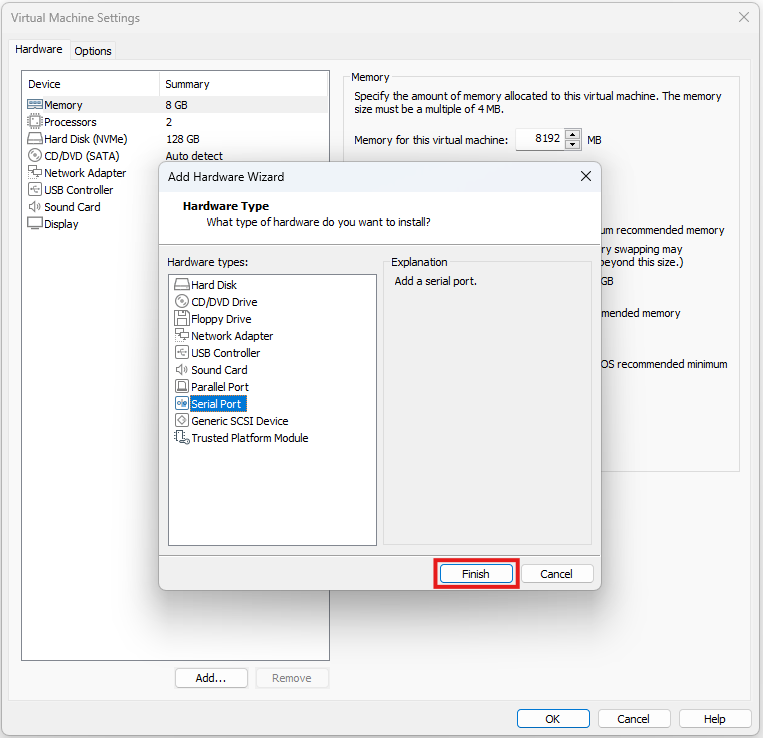
Then shut down the VM, select VM -> Settings -> Add from the top menu, and add a Serial Port.
Configure the added Serial Port as follows. Note that selecting “The other end is a virtual machine” instead of “The other end is an application” also seems to work for connection.
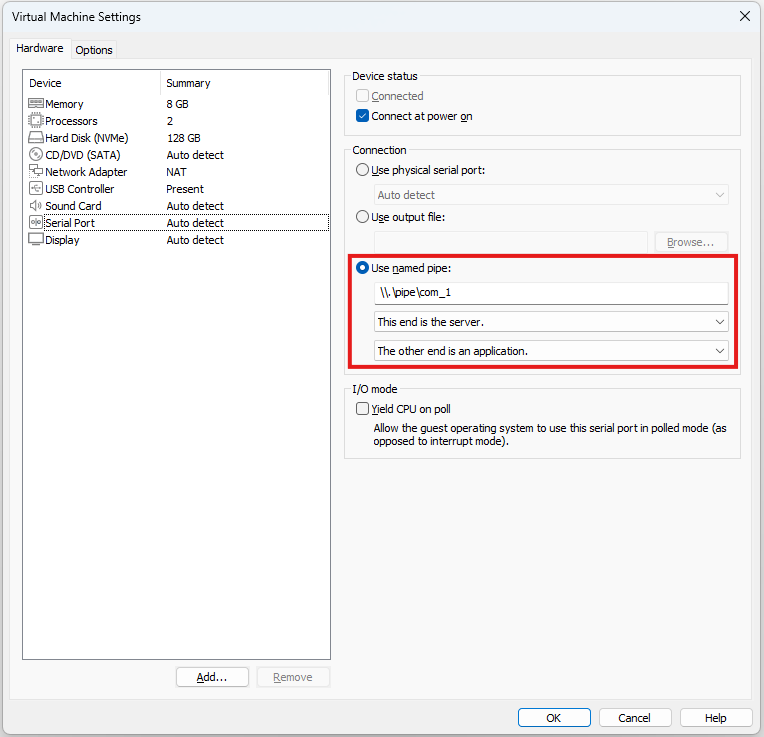
Finally, starting the target VM connects it to the host.
0x02. Commands
Modules
lm (List Modules)
Lists loaded modules or checks information for a specific module.
kd> lm
kd> lm m fltmgr
kd> lm Dvm fltmgr
Note that kernel mode regions load at high addresses like fffff800'00000000.
x (eXamine symbols)
Searches symbols or finds specific symbols.
kd> x win32k!
kd> x win32k!vStr*
Symbols
!sym noisy (Noisy symbol loading)
Displays detailed symbol loading process. Good for debugging loading-related issues.
kd> !sym noisy
!sympath (Set symbol path)
Sets the path to symbol server or local directory where symbol files are stored.
kd> !sympath SRV*C:\symbols*https://msdl.microsoft.com/download/symbols
kd> !sympath C:\symbols
.reload (Reload symbols)
Reloads symbols. The /f option forces symbol loading.
kd> .reload
kd> .reload /f CLFS
Memory
db dw dd dq (Display memory)
Displays memory in byte, word, double word, and quad word units respectively. You can specify the count by adding L[Length], specify range by entering the end address, or use register names to read and use values stored in registers.
kd> db [Address]
kd> dw [Address] L[Length]
kd> dd [Address] [Address]
kd> dq rsp
ds du dc (Display string)
Displays memory as ASCII and Unicode strings respectively. dc displays both hex values and strings simultaneously.
kd> ds [Address]
kd> du [Address]
dps (Display Pointers and Symbols)
Interprets and displays pointers stored in memory based on symbol information.
kd> dps [Address]
u ub uf (Unassemble)
Interprets and displays instructions in memory as assembly. Using basic u together with ub, which displays assembly code in reverse from the input address, is convenient for viewing instructions before and after at once.
uf displays the entire function. You can input any location within the function, not just the beginning. However, symbols must be properly loaded.
kd> u rip
kd> ub rip
kd> uf [Address]
Information
!analyze -v (Analyze crash dump)
When a crash occurs, it displays various information including the general cause and register states.
kd> !analyze -v
k kv (Stack trace)
Displays the current thread’s call stack. The kv command also displays the values of passed arguments.
kd> k
kd> kv
!process !thread (Process / Thread information)
Displays process information. Using !process alone displays detailed information about the current process. Adding 0 0 displays brief information about all processes. To check specific process information, input that process’s address.
!thread displays thread information. When used alone, it displays current thread information. Inputting a specific thread address displays that thread’s information.
kd> !process
kd> !process 0 0
kd> !process [Address]
kd> !thread
kd> !thread [Address]
Debug
bp ba (Break Point)
Stops execution at the specified address or symbol. The ba command can stop on read/write/execute operations on specific memory.
kd> bp 0x401000
kd> bp ntdll!NtCreateFile
kd> ba [r/w/x/rw][Length] [Address]
p t pt g pc (Flow control)
Various debugging flow control commands exist: p(ni) executes the next instruction, t(si) executes the next instruction and steps into functions, pt executes until function completion, g runs until the next breakpoint, and pc runs to a specific address.
kd> p
kd> t
kd> pt
kd> g
kd> pc [Address]